Home Oelinger
sitemap
a – z

|
|
Home Oelinger sitemap a – z |

|
Table header: Sum / Subject (Chapter Survey) / pages / Exam Relevant (x 3) / Exercise (x 2)
| Sum | Subject | Pages | Exam Relevant (x 3) | Exercises (x 2) | ||
|---|---|---|---|---|---|---|
| 12 | Chapter 1 - 1.1 | Number | Numb. | Numb. x 3 | Numb. | Numb. x 2 |
| 14 | 1.2 | Numb. | Numb. | Numb. | Numb. | Numb. |
| 6 | 1.3 | Numb. | Numb. | Numb. | Numb. | Numb. |
| 29 | 1.4 | Numb. | Numb. | Numb. | Numb. | Numb. |
| 1 | Chapter 2 - 2.1 | Numb. | Numb. | Numb. | Numb. | Numb. |
| 12 | 2.2 | Numb. | Numb. | Numb. | Numb. | Numb. |
| 12 | 2.3 | Numb. | Numb. | Numb. | Numb. | Numb. |
| 22 | Chapter 3 – 3.1 | Numb. | Numb. | Numb. | Numb. | Numb. |
| 6 | 3.2 | Numb. | Numb. | Numb. | Numb. | Numb. |
| 5 | 3.3 | Numb. | Numb. | Numb. | Numb. | Numb. |
| 12 | 3.4 | Numb. | Numb. | Numb. | Numb. | Numb. |
| 25 | 3.5 | Numb. | Numb. | Numb. | Numb. | Numb. |
| 156 | Total | Total | ER-WER total | EC total | ||
Table 1: Data
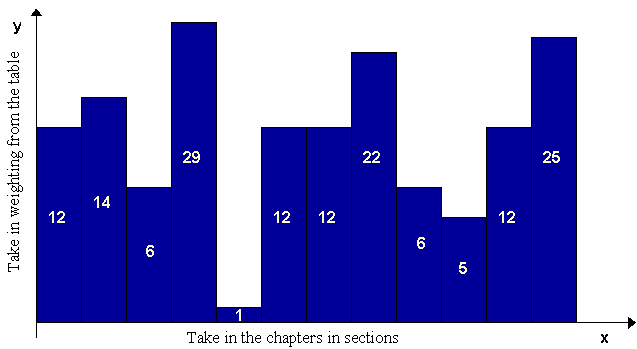
Tranform into graph:
y-axis: Weights, i.e. Total of the first table column
x-axis: Sections
Write the number from the first table colunmn into the bars

Illustration 1: Bar chart which shows the collected data.
Feel free to send me email: maria@oelinger.de
|
© 2001 Maria Oelinger cand. math. |
Schedule |
Last Update: 21.04.2001 Address: http://www.oelinger.de/maria/en/schedule_01.htm |